Where we are, what happens next, and the end game
One-line verdict
We are standing just past the top of the bubble, at level 2 of the 5-level write-off cascade. What follows is not a one-step collapse but a three-act program: rallies bury the dip-buyers -> write-offs get confirmed -> defaults deliver the verdict. The end game is a long clearing from 2028 to 2032 -- de-bubbling is the market healing itself. The buy year is not the crash day; it is the true starting point of the AI industry.
The logic spine: why de-bubbling is normal market behavior
Install this causal chain before reading any section -- every trigger in this handbook hangs from it.
P1 -- The only criterion is AI ROI data
Whether the AI revolution works has exactly one test: can application-layer unit economics close? Current reality: value-chain profits pool in a single hardware layer (NVDA gross margin 71%; the memory cartel lifted conventional DRAM roughly 700% in four years), model labs burn billions a year, and the application layer scales without profits. In an industry whose two downstream layers are broken, hardware-layer profit is not profit -- it is an advance against a future that cannot pay.
P2 -- Open source has capped the paying ceiling; the revenue base is cut at both ends
Kimi/DeepSeek-class open-source, near-free models cap what enterprises will ever pay: the capability gap closes at roughly 1 point per month (80.6 vs 88.7 today, hitting the 85-88 agent threshold in H1 2027), so closed labs have lost pricing power -- there is always a nearly-free anchor. On the consumer side, only about 5% pay (Adam's anchor; consistent in magnitude with public paid-conversion estimates). Anthropic and OpenAI are therefore squeezed from both ends: hardware taxes them upstream while open source caps their revenue downstream -- the middle layer's business model does not close mathematically, and survives on circular financing (which is precisely the root cause of the vendor-financing evidence chain in Section V).
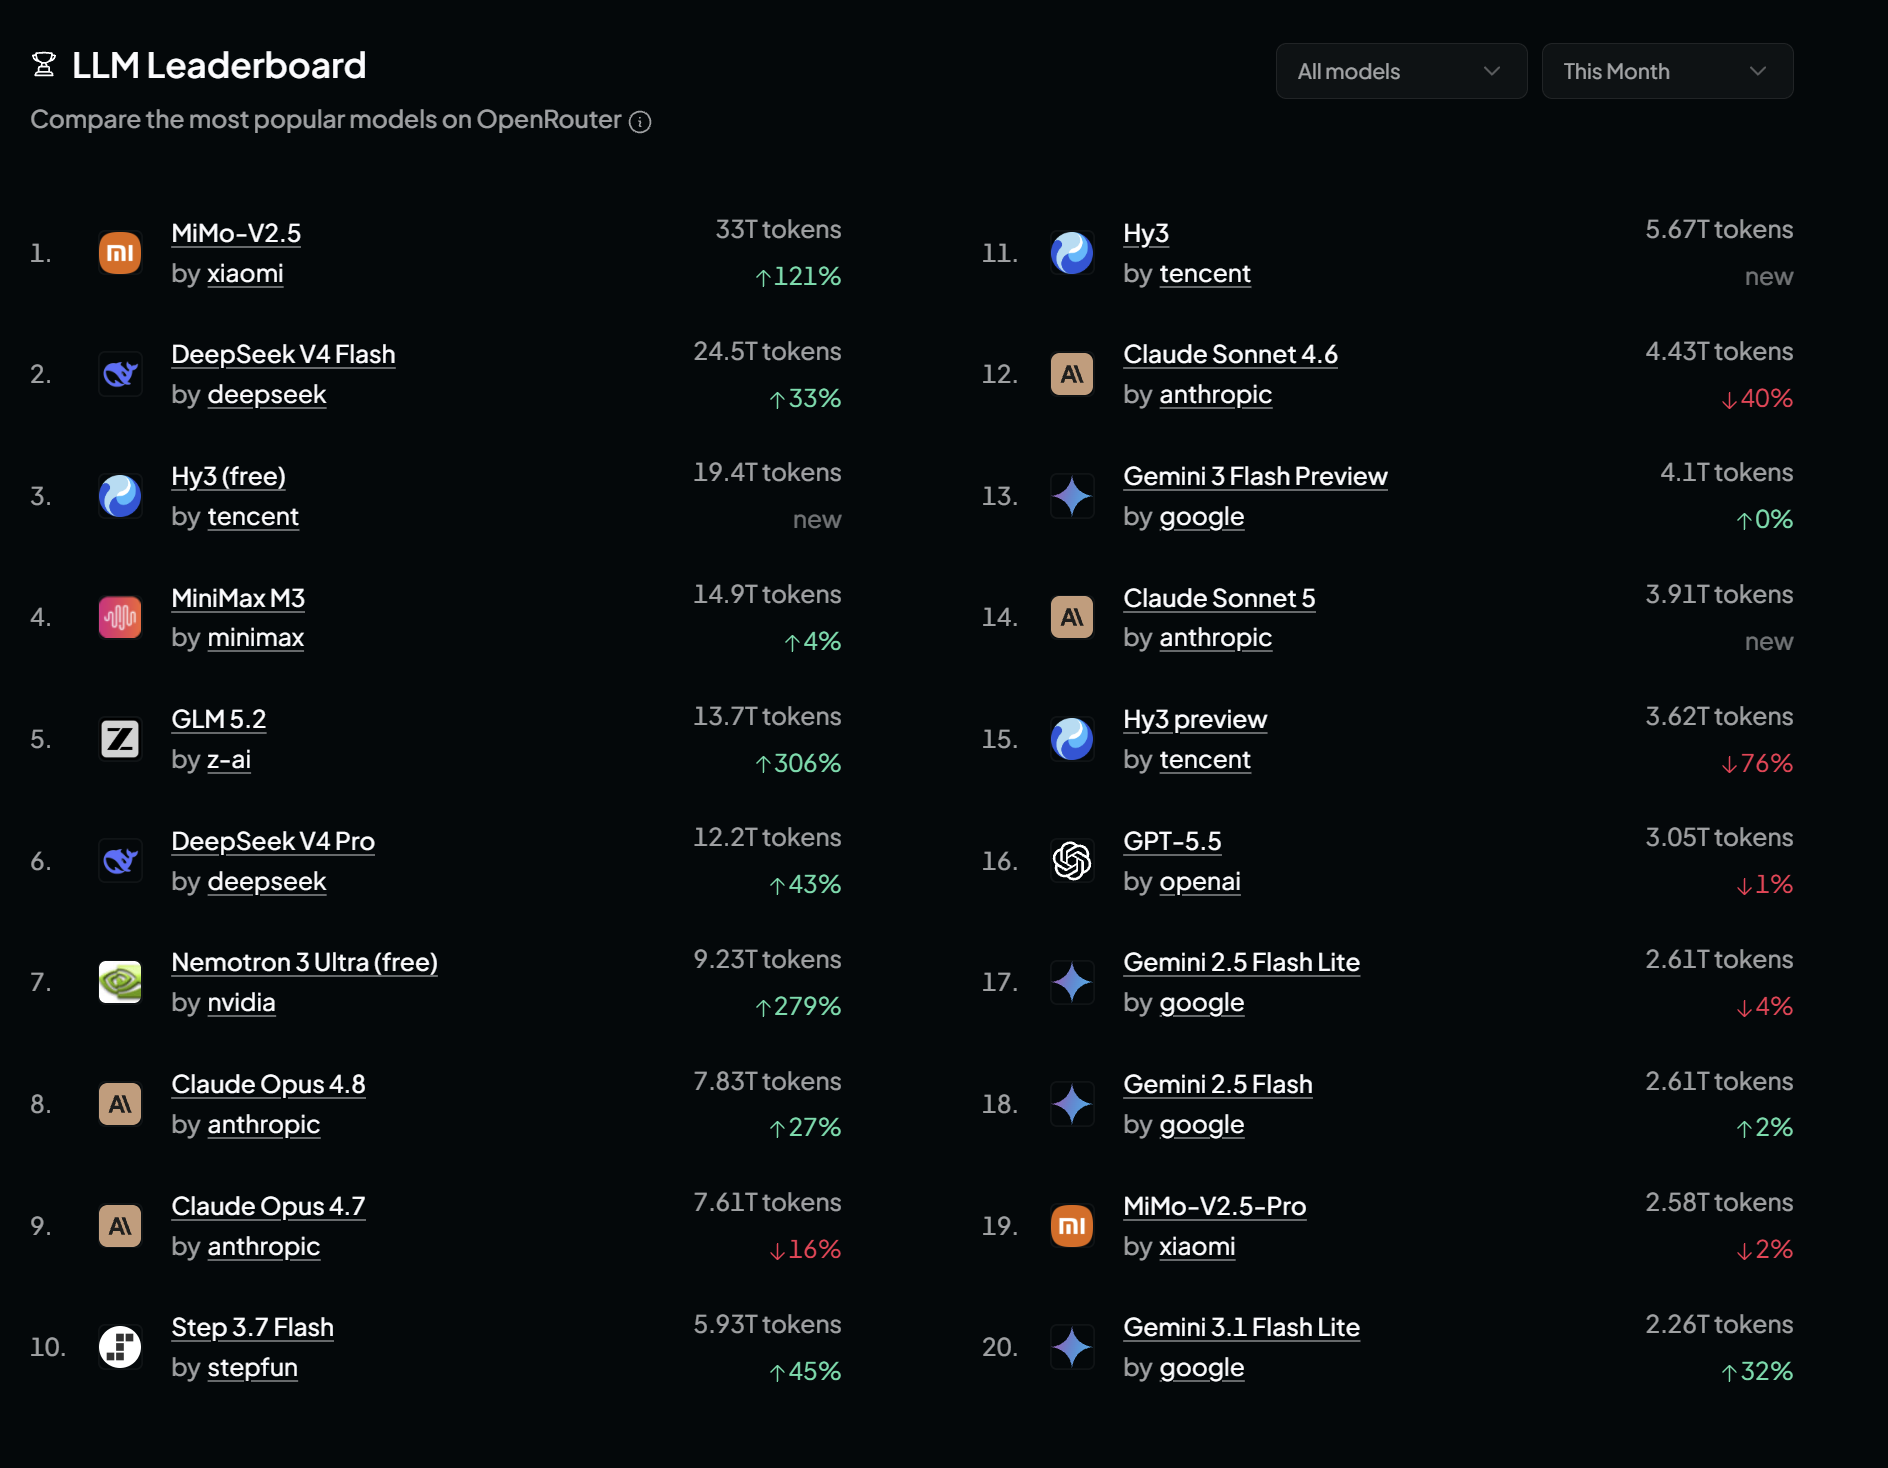
This chart is P2 in real time: token consumption is usage voting with its feet. On this price-routed marketplace, Chinese/open models take roughly seventy percent of the flow. The honest boundary: OpenRouter is only the price-sensitive edge of the market and excludes Anthropic/OpenAI first-party enterprise API traffic -- but substitution always begins at the price-sensitive edge and spreads toward the core; the marginal buyer's revealed preference is the leading adjudicator of pricing power. "Open source caps the paying ceiling" is not a forecast; it is this month's leaderboard.
P3 -- Hardware margins this high are unhealthy; the rent is killing its own demand
A 71% gross margin is a tax on the entire industry. Until the tax falls, the application layer can never reach scale economics and the AI revolution cannot run -- monopoly profit is destroying its own demand side; the structure is self-negating. Hardware margins must normalize (into the 40s, manufacturing territory) and token costs must approach utility pricing before the AI industry can actually develop. That is not a bear's wish; it is a survival requirement of the industry itself.
P4 -- Therefore de-bubbling is self-healing, not disaster
What the market is doing right now -- repricing credit name by name, punishing capex raises, marking GPUs down to 27% of original price -- is the normal mechanism that beats the tax rate back to a sustainable level. Every short section of this handbook is not a bet against AI; it is a bet on AI after the rent is gone. The clearing is the precondition for Wave 3 real applications. The reason the entry window around 2032 is a generational opportunity is precisely that it is the first moment application-layer unit economics can work.
Where we are (2026-07-29, all verified)
The top signatures are complete: buyers panic-locked $950B of supply at the peak (a textbook specimen of top behavior); July semis lost over $1T of market cap in a month; the "capex raises get punished" regime has been confirmed twice by TSM and GOOGL; and on 07/27 -- two days before earnings -- the 5-year CDS of ORCL, Meta, NVDA and GOOGL all set records on the same day, with NVDA doubling in a month. Of the five cascade levels, level 1 (earnings revisions) has fired and level 2 (rating downgrades) has its first case (ORCL at BBB-), while level 3 (financial-institution write-offs) stands at zero -- but its physical preconditions (GPU residual value at 27%, BDC discounts at 26%) are fully in place; only the accounting acknowledgment is missing. The Fed is in a hawkish hold: core PCE at 3.4% is not tamed, the dot plot implies one more hike, and the market prices 5.4%. Two stratifications exist at once -- single-name CDS vs the HY index, dots vs futures -- the market is admitting name by name while denying at the system level.
What happens next (in sequence, each step with its verdict point)
| Window | Event | Verdict point |
|---|---|---|
| This week -> 08/26 | The earnings meat grinder: MSFT/Meta/AMZN/AAPL (07/29-31) + the NVDA final review (08/26) | Capex raise sold = third regime confirmation; single-name CDS through earnings week = credit-side cross-check |
| 08/12 | July CPI: oil, electricity and memory pass-through hit the print | Hot print -> December hike pricing re-arms from 5.4% (it hit 51% in May); the AI OPEC thesis ignites |
| Q4 2026 | Earnings-revision season: FY27 guidance cuts scripted as "component pricing normalization" + first mark-to-market prints + the NAND reversal light | Main harvest leg; target zone QQQ 560-600 / VIX 28-40; cascade level 1 completes |
| December | Risk cluster: SPCX lockup expiry (12/12) + FOMC (a hike is the tail case; a hot CPI arms it) | Whether Dec 2018 repeats; tactical longs cleared before 12/12 |
| 2027 | The knife-catcher year: 2-3 bear rallies of +15~30%; durable rally only 40-50% | First AI-collateral write-off = cascade to 3/5 = KS-7 fires. Reverse falsifier: zero write-offs by Q2 2027 with HY <320 = revert to the 2019-style pivot-rally script |
| 2028 | Layer 2 collapse: physical AI falsified + no next relay narrative | NVDA -70~80% terminal zone; write-offs go from cases to a wave |
| Late 2028 - H1 2029 | Default-wave window (the WorldCom interval: peak +28 months) | Largest single blow-up candidates: leveraged neoclouds / SPV structures / holding-company leverage; HY OAS through 500 = KS-2 fully triggered |
End game
Compute becomes a utility: NVDA gross margin normalizes from 71% into the manufacturing 40s, P/E settles at 15-20x, token costs approach water-and-power pricing -- that is the terminal state, not a point of disagreement; the only dispute is the length of the road. A debt crisis is the 25-30% tail, not the baseline: the baseline is an orderly clearing of name-by-name repricing, a write-off wave, and individual defaults; the transmission channel that could upgrade it to systemic is the bank-to-NBFI pipeline (over $1.2T, which regulators admit they cannot see through). The clearing bottom window: the aggressive read is 2029 (the default wave clears, the bottom is in); the Benner read is 2032 (the buy year). Every "bottom confirmation" between those two dates gets treated under bear-rally discipline. Around 2032 is the generational entry: real applications (agents, embodied AI, vertical AI) get workable unit economics for the first time on de-rented soil. The position doctrine stands: rolling 2-12 month puts on the short side, the 30-40% cash rule, Wave 2 rented not owned, tranche 3 frozen until write-offs clear.
Corrections
Correction 1: The capex direction was falsified
Phase one is not "guidance cuts" -- it is raises getting punished. TSM raised to $60-64B and was sold 4%; GOOGL raised to $195-205B and was sold 5%. The real cuts arrive in the October FY27 guidance season, scripted as "component pricing normalization."
Correction 2: Buyers are panic-locking supply, not cutting orders
MU signed 16 multi-year agreements worth $22B; Musk publicly wailed "pretty insane" while locking years of capacity. The $950B Korea-US supply package of 7/25-26 (see Section IV) is the largest specimen of the same behavior: peak-panic supply lock-ins are a top signature. The buyers' revolt belongs to the 2027 contract-renegotiation season, not to now.
Correction 3: The paying cliff is a trajectory, not a current state
The China/open-source band closes on the 85-88 agent threshold at roughly 1 point per month (now 80.6 vs 88.7), arriving H1 2027 -- exactly the quarter when Anthropic's ~$40B/yr and OpenAI's committed contract step-ups take effect. The scissors close on a calendar date.
Correction 4: The -80% belongs to 2028, not May 2027
Layer 1 (H2 2026) = datacenter de-bubbling, -30~40%. Layer 2 (2028) = the digital-plus-physical double kill after the relay narrative is falsified: -70~80%, P/E 15-20x terminal. The character of the interval between them was repriced by the Section V cascade vet: downgraded from "long leg" to "tactical bounce leg."
Correction 5 (new in v2.1): The "77% December hike pricing" was a misread
Live FedWatch (07/28): December hold 78.2% / cut 15.4% / hike just 5.4%. v2.0 misread the hold probability as hike probability. But the June dot plot's YE2026 median is 3.8% (vs 3.4% in March) -- the FOMC's own median path implies one more hike. Market 5.4% vs dots implying a hike: the divergence itself is the position (see Section IV).
The Benner cycle prior: sell 2026, buy 2032
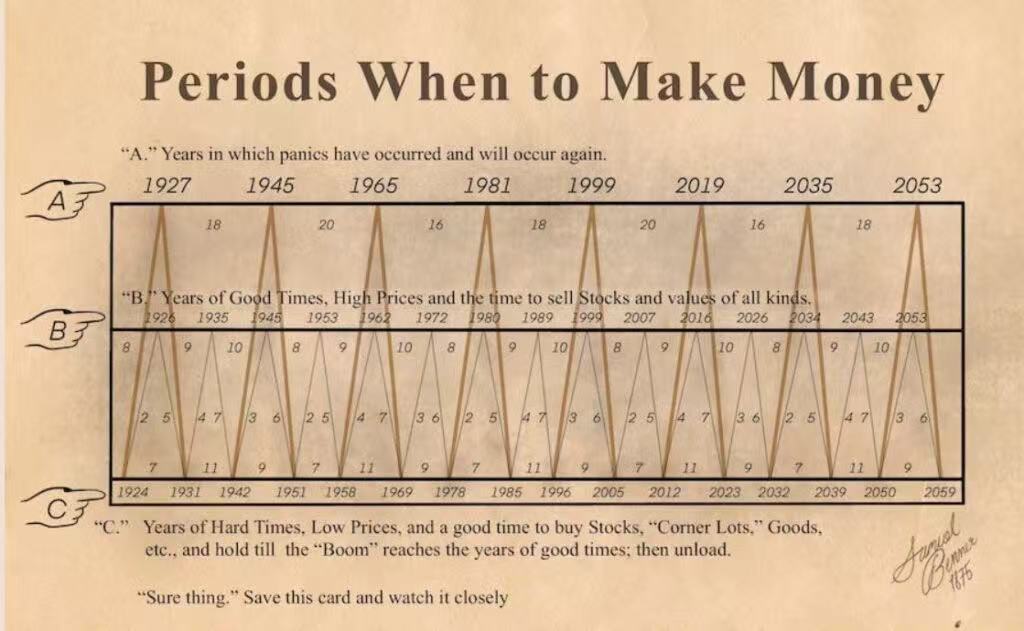
This 150-year-old farm-and-commerce cycle card runs on an 8-9-10 year rhythm. Its relationship to this handbook is prior calibration, not evidence. Its hits deserve respect: the 1999 sell year against the 2000 top, the 2019 panic year against the 2020 crash, the 2023 buy year against this bull market's origin (Nasdaq bottomed December 2022). Its misses go on the ledger too: no panic in 1945; 1965's counterpart was the 1966 credit crunch. The rhythm is a statistical rhyme, not a law of physics.
Benner x cascade composite path (projection)
Laying the five-level cascade of Section V onto the Benner rhythm yields one falsifiable composite path. Historical calibration: from the March 2000 top to the WorldCom blow-up (cascade level 4) took 28 months; to the final bottom (October 2002), 31 months; the durable rally launched from -78%. Anchoring this cycle's top at H2 2026 and extrapolating level by level:
| Year | Benner row | Cascade position | Projection |
|---|---|---|---|
| H2 2026 | Row B sell year | Level 1 fires | Layer 1 breaks. Top signatures complete: the $950B peak-panic supply lock, $1T of July semi cap erased, buyers wailing for capacity. Earnings revisions spread from AVGO/IBM into the FY27 guidance season. |
| 2027 | Downleg | Level 1 -> 2 | Revisions fully print; sell-side turns systematically bearish (KS-6 fires). Expect 2-3 bear rallies of +15~30%, all failing -- the knife-catcher year. Even if the durable rally (40-50%) materializes, it is a rental leg; the path does not change. |
| 2028 | Downleg | Level 2 -> 3 | Layer 2 collapse (NVDA -70~80% terminal zone) + the first financial write-offs: GPU residuals (now 27%) crash through lease/ABS model assumptions, private-credit marks get forced by auditors, BDC discounts (median 26%, March 2026 print) convert into recognized losses. |
| 2029 | Downleg | Level 3 -> 4 | Default-wave window. The WorldCom interval (peak +28 months = late 2028 to H1 2029) points at the largest single blow-up: leveraged neoclouds, SPV structures, SoftBank-style holding leverage. HY OAS through the 500 crisis zone = KS-2 fully triggered. |
| 2030-31 | Hard times | Level 4 -> 5, or clearing | The liquidation leg: low-volatility grind, massive policy easing, nobody talks about AI. Whether the debt crisis upgrades to systemic (the 25-30% tail) is decided here -- the transmitter is the bank-to-NBFI pipeline (over $1.2T, an FSB blind spot). |
| 2032 | Row C buy year | Clearing complete | "Hard times, low prices, buy corner lots." Wave 3 entry year: real applications close the ROI loop on de-rented soil. The generational entry point. |
| 2034-35 | Row B 2034 / Row A panic 2035 | Next cycle | The recovery top and the next panic. Reserve the next sell card per the Benner rhythm. |
Falsification conditions for this path: zero write-offs by Q2 2027 with HY OAS below 320 (KS-7 reverse) -> this path is void, revert to the 2019-style pivot-rally script. Conversely, the first AI-collateral write-off landing -> this path upgrades from "prior" to "base case."
Master timeline
P0 / now -> 2026-08-15 / short leg
The meat grinder: mega-cap earnings week
The reaction function has been confirmed twice by TSM and GOOGL. July 29-31 is the same grinder running tests #3-#5; 80% odds at least one name gets sold.
- 07/29-31: MSFT / Meta / AMZN / AAPL earnings. Single criterion: does a capex raise get sold or rewarded?
- 08/12: July CPI. Oil plus AI input costs (electricity +4.0% YoY, memory/component pass-through) hit the print. A hot print re-arms December hike pricing from 5.4% (May precedent: it reached 51% during the inflation shock).
Triggers: the "component pricing" number upgrading (April's $5B -> ?); the quality of MSFT's answers on the OpenAI $250B inside RPO; whether Meta announces an equity raise; FY27 capex adjective counting ("significantly higher").
Action
August legs: lock 30% pre-market Tuesday, realize 50-70% on reaction days, flat by 08/12. Front-month rule: never hold front-month through its theoretical ceiling.
P1 / 2026-08-15 -> 09-30 / short leg
The final review: NVDA's reaction-function verdict
The numbers will be spectacular (GOOGL's $205B capex is NVDA's order book). The only variable is which rulebook the market prices them under.
- 08/26: NVDA earnings. Sold (55-60%) = beat-then-die #4, the last sanctuary falls; rewarded (40-45%) = the tax regime renews, weak hands push F&G toward Greed.
- Mid-September: hawkish FOMC hold; December dots set (June median already 3.8%).
- September: the Anthropic $900B+ round result = the circular-financing life-support verdict (vendors share one incentive: get it closed).
- Late September: front-running research on the SPCX 12/12 lockup expiry begins.
Triggers: first mark-downs printing inside NVDA's own equity book (CRWV/Nebius/xAI); customer-concentration disclosure; whether guidance stops being explosive.
Action
Sold -> press front-month. Rewarded -> wait per F&G discipline, load the second Dec'26 batch at Greed 55+/75+. The 9/18 leg: unconditionally flat by 9/15.
P2 / 2026-10-01 -> 11-03 / short leg
Main harvest: the earnings-revision print layer
Price front-ran in July; October is when it hits the books: full depreciation, the priciest memory contracts entering COGS, and the FY27 guidance season. The precise shape of "ugly Q3" = margins plus guidance plus book losses all darkening at once -- not a revenue miss.
- Mid-October: Q3 earnings; operating margins compress across the board; the pre-scripted "component pricing normalization" cut language debuts.
- Mid-October: first mark-to-market print. GOOGL's $94.1B SpaceX stake -> an estimated $25-30B book loss, whiplashing Q2's $99B gain.
- Early October: NAND Q3 contract price QoQ. Below +30% = memory reversal confirmed = the final confirmation light for the Jun'27 leg.
- 11/03: midterm elections; peak inflation-scapegoat politics.
Target zone: QQQ 560-600 | SPX 6,300-6,700 | VIX 28-40.
Action
Harvest the Dec'26 legs at first-leg targets; realize 1/3-1/2 of the Jan'28 spread, keep the rest as Layer 2 insurance; the 30-40% cash rule does not move.
P3 / 2026-11-03 -> 12-12 / gear-change window
Side-switch window: the mechanical bounce
Short-covering plus election resolution plus front-running the 2027 pivot. The bounce has no sustainable logic, but it has mechanical logic. Your discipline is to use it, not deny it. v2.1 note: after the Section V vet, every rally here and in P5 gets bear-rally discipline -- rentable, never holdable.
- At VIX 30-40, sell cash-secured puts at the -40% tier on GOOGL/TSM: get paid to wait for Wave 2 entry prices.
- Wave 2 tranche 1 (1/4 of ammunition only): GOOGL > TSM > GEV > AMZN.
- On an SPCX bounce to $130-150, build post-December expiry puts (the lockup trade; first target the $70-80 flow floor).
- Never-buy list: memory / neoclouds / humanoids / TSLA / SPCX longs. (Conflict disclosure: the thesis tracker's sister-long basket contains a TSLA long stub (2026-05-12), in direct conflict with this list. This handbook is the later document (post 07/26) and governs for now; final call belongs to Adam.)
P4 / 2026-12-12 -> 12-31 / short leg
Risk cluster: lockup expiry + FOMC
A potential replay of December 2018: Warsh hiking into a weak tape = the last hawkish performance, and the ritual by which the bubble's death cures inflation and paves the 2027 turn. v2.1 correction: the hike is not the baseline (market prices 5.4%) -- it is the tail case, armed if inflation re-heats through August-November (triggers in the Section VI Fed card).
- 12/12: SPCX lockup expires; $200B+ of potential supply; the front-run already happened in October-November.
- Mid-December: FOMC. Baseline hawkish hold; if CPI runs hot consecutively, a 25bp hike lands on a weak tape (the Dec 2018 structure).
Action
All tactical longs out before 12/12. If the tail-case hike smashes out a capitulation low -> tier-2/3 prices appear -> tranche 2.
P5 / 2027 Q1 / gear-change window (downgraded from long leg in v2.1)
Ignition: the pivot and the third-year engines
Original judgment: the third-year rally needs no AI repair (Nasdaq +50% on the 2003 rubble, +29% in 2019 on zero earnings growth). v2.1 downgrade rationale (Section V): the debt-cycle variable severs the comparability of 2003 and 2019 -- 2019-type (no debt clearing, pivot = rally) and 2003-type (rally from -78% after the debt cleared) are different species. This cycle's debt structure looks like 2000-02; durable-rally probability cut from 65-70% to 40-50%.
- Fed pivot: wealth-effect destruction + layoffs = demand destruction = inflation cured. But the base rate: the Fed cut 11 times in 2001 and the market fell two more years. A pivot is necessary, not sufficient.
- Capex cuts -> FCF explosion: the Meta 2023 template -- a regime that punishes capex raises symmetrically rewards cuts. This engine stands.
- Reset launchpad: a covering rally from -20~30%. Downgraded to tactical.
- National will: the 2028 election needs a floor; an OpenAI IPO restart = the house's maintenance machine flips back ON.
Action
Pivot signal -> tranche 2 (tranche 3 stays frozen until the Section V cascade reaches level 4 and clears); treat an ORCL capex-cut announcement as its "Meta moment" (the trade-to-hold upgrade test).
P6 / 2027 Q2 -> Q3 / adjudication leg
Ride and scout: the scissors close, elasticity decides
The rally (if any) shares the stage with the physical-AI climax. In the same quarter, two known curves intersect: the band touches the 85-88 agent threshold x Anthropic's ~$40B/yr and OpenAI's committed step-ups take effect.
- The version verdict: real demand elasticity after cheap tokens >1 (Version A) -> fill tranche 3, hold to the end.
- Elasticity <1 (Version B) -> the rally is Layer 2's final mania -> longs stop; open the 2028 short list (pure-play humanoids / TSLA / Figure if it IPOs).
- The SNDK Jun'27 leg harvests with the NAND reversal in H1'27 (the -50~70% path).
Consumer-side indicators: OpenAI ad rollout progress (= the subscription surrender note); free-tier capability vs paid-tier gap; NET pay-per-crawl monetization.
P7 / 2028+ / terminal
Layer 2 collapse: the terminal
Physical AI falsified (humanoid mass production slips + robotaxi economics fail) + no next relay narrative. The original report's terminal verdict lands here -- one relay baton late. v2.1 note: if the Benner rhythm wins, the liquidation extends to 2030-2032; the buy year is not the crash day.
- NVDA -70~80% (digital plus physical double kill), P/E to 15-20x, margins normalize to manufacturing 40s.
- Memory margins from 84.6% to teens or losses (trough custom); compute becomes a utility, token cost approaches water and power.
- Hunting ground: residual Jan'28 positions + 2028 LEAPS. Prey: pure-narrative humanoid names.
- Real applications (agents / embodied / vertical AI) close the ROI loop on de-rented soil -- Version A's Wave 3 starts here.
Rally path projection and short-timing table
Clearing-period rallies are not noise; they are loading windows -- every short-entry discipline hangs inversely on a rally. Historical anchor: 2000-02 Nasdaq produced four bear rallies of +30~40%, all of which failed. Magnitudes below are index-level; high-beta AI single names typically bounce 2-3x the index (rallies hurt shorts most in single names -- which is exactly why the batch discipline exists).
| # | Rally window | Driver | Est. magnitude (index) | Character | Short action (timing + instrument) |
|---|---|---|---|---|---|
| R1 | 07/29 -> pre-08/26 | Post-earnings snapback if MSFT/Meta get rewarded + NVDA pre-print front-run | +3~6% | Event snapback | Load August legs at the snapback tail (30% pre-market lock rule holds); act only at F&G 55+; never add shorts in the Fear zone (KS-4) |
| R2 | Post-08/26 (if NVDA rewarded, 40-45%) | Tax-regime-renewal narrative, weak hands chase, F&G runs to Greed | +5~8% | Bull trap | Second Dec'26 loading window: scale at Greed 55+, full at 75+; in the sold scenario (55-60%), press front-month immediately, no waiting |
| R3 | 11/03 -> 12/12 | Election resolution + short covering + 2027 pivot front-run (P3 mechanical bounce) | +8~15% (from the P2 target zone QQQ 560-600) | Mechanical bounce | Long side rented only (tranche 1, 1/4 ammo); SPCX $130-150 bounce -> build post-December lockup puts; tactical longs flat by 12/12; at the rally tail (VIX under 20) load the December FOMC leg |
| R4 | 2027 Q1-Q2 (the pivot rally -- largest and most dangerous) | Fed pivot + capex-cut FCF narrative + FOMO chase | +15~30%; durable odds only 40-50% | Adjudicated by KS-7: first write-off lands = bear rally; zero write-offs and HY <320 = 2019-type script | Never short into the Fear-zone launch; wait for the Greed swing; scale Jun'27 legs at Greed 55+, Jan'28 legs at 75+; press from the day a write-off lands; if KS-1's four conditions all fire -> stop adding shorts, reassess the framework |
| R5 | 2027 H2 (physical-AI climax, P6) | Robotaxi/humanoid IPO wave + world-model narrative | +10~20% (concentrated in narrative names) | Version verdict: elasticity >1 = real rally; <1 = Layer 2's final mania | After elasticity <1 confirms, build the 2028 short list at the IPO-mania top (pure-play humanoids / TSLA / Figure if listed); instrument = 2028 LEAPS puts (here the duration finally matches the script -- LEAPS no longer die of theta) |
| R6 | Inside the 2028-2031 clearing | Every "bottom is in" chorus (policy rescues / mega-cap support / value-buyer dips) | +10~25%, repeatedly | Knife-catcher rallies | No new shorts (the main downleg is done); switch to Wave 2/3 accumulation discipline: buy tier prices only after HY OAS rolls over from its peak and the write-off wave passes; primary accumulation window around 2032 |
Uniform discipline (entire table): shorts load only at rally tails, never chase weakness down (chasing = adding shorts in the Fear zone = the bear trap); every leg carries KS-3 profit protection (give back 50% of peak gains = cut, no narrative appeals); instruments follow the thesis-tracker mainline -- rolling 2-12 month OTM puts before 2028, the single exception being R5's 2028 LEAPS (by then duration and script align).
The AI OPEC suppression thesis: an evidence review
The thesis as stated: the NVDA CEO's $950B contract with Korean HBM makers is the cartelization of a monopoly business -- an AI OPEC. The bet: the Fed will hike to suppress this unhealthy AI tax, the way America once suppressed Japan.
The facts (all live-verified, 2026-07-28)
Source-grading legend (T1-T5, used throughout this document)
T1 = physically or economically unforgeable: market prices, court filings, official data, SEC filings -- hard constraints, tradeable. T2 = the same event cross-confirmed by 3+ independent sources of different alignment -- treated as hard fact. T3 = single source with specific checkable detail (dates/places/numbers) -- medium confidence, must be flagged as single-source when used. T4 = single source, vague wording ("reportedly," "sources say") -- not used as fact, narrative data only. T5 = opinion/commentary/official statements -- reflects positioning, not facts. Rule: conclusions may stand only on T1/T2; T3 informs but is flagged; T4/T5 feed narrative-warfare analysis only.
| Grade | Fact | Bearing on the thesis |
|---|---|---|
| T2 | Korea-US summit, 7/25-26: the $950B supply package is real, but its structure = SK hynix-NVDA $750B (5-year HBM supply + co-development) + Samsung-Broadcom $200B. Dollar-denominated; not a single NVDA contract. Note: the $950B bundle is T2; the $750B single-leg split is not fully reconciled with earlier $500B reports and leans T3. | Direction supported, figure corrected |
| T1 | Federal antitrust class action, 6/25 (Garciaguirre v. Samsung, N.D. Cal.): alleges Samsung/SK/Micron (~90% of DRAM, 95%+ of HBM) used the HBM transition as cover to curtail DDR4 output, inflating conventional memory ~700% over four years; Sherman Act Section 1. | Cartel behavior is already in a court filing -- harder than the "OPEC" metaphor |
| T3 | HBM share, Q2'26: SK hynix 62% / Micron 21% / Samsung 17%. Three firms ~100%. | Supply-side oligopoly confirmed |
| T1 | Warsh sworn in as Fed Chair 5/22; rates at 3.50-3.75% unchanged since Dec 2025; June dot plot YE2026 median 3.8% (3.4% in March) = one more hike implied. | The hawkish turn is real |
| T2 | FedWatch 07/28: December hold 78.2% / cut 15.4% / hike just 5.4%. Hike pricing reached 51% during May's inflation shock (fading after the weak 7/2 payrolls). | The market currently disbelieves the hike |
| T1 | Core PCE 3.4% (May); electricity +4.0% YoY (June); multiple economists list 2026's ~$700B+ AI datacenter capex as an inflation driver in memory, processors and electricity. Warsh's 7/14 testimony pledges a "regime change" to rid inflation as a "tax." | The inflation channel exists -- and Warsh used the word "tax" himself |
| T2 | But Warsh's 7/15 Senate testimony personally played down the AI-inflation link: AI spending "may lift prices without fueling lasting inflation." Trump installed Warsh to get cuts, easing pressure only after inflation topped 4%. | Direct counter-evidence on motive |
Mechanism-level correction: three cuts
First, the cartel structure: confirmed, and more complete than as stated. "AI OPEC" is not one contract; it is two stacked layers. Upstream: a three-firm memory oligopoly already accused in a court filing of supply-side curtailment. Downstream: NVDA using a $750B five-year lock to buy priority over scarce HBM capacity (demand-side lock-in). The monopoly meaning of the latter: AMD and every custom ASIC need HBM too -- locking the upstream chokes rival accelerators at the throat. That is monopoly maintenance, not mere supply assurance.
Second, the Fed arm: the motive fails, the function can hold. The Fed's statutory anchors are inflation and employment, not monopoly rents -- rent suppression belongs to the DOJ/FTC/USTR toolbox. No official communication contains any intent to "suppress AI," and Warsh personally downplays the AI-inflation link. But the mechanical chain exists independently of motive: AI capex -> electricity/memory/construction costs -> CPI -> the inflation reaction function -> rates up -> the discount rate compresses long-duration AI narratives. If the inflation path runs hot, the Fed suppresses the AI tax functionally whether it wants to or not. The dots-at-3.8% vs market-at-5.4% divergence is the pricing gap on that chain.
Third, the Japan analogy: half right, and it must be split into three parts. (a) Plaza Accord 1985 = a currency weapon against a foreign rival. (b) The 1986 US-Japan Semiconductor Agreement + 1987 tariffs = trade/judicial weapons against a foreign memory cartel -- today's closest rhyme is precisely the 6/25 antitrust action against the Korean memory makers; that arm is already swinging, only the executor is a court, not the Fed. (c) What pierced Japan's bubble was Japan's own central bank (BOJ hikes, 1989-90); mapped to today that is "the Fed against its own bubble," and its motive can only be inflation, never industrial suppression -- NVDA is the national flagship, not a foreign rival. The BIS has already drawn the scale analogy: AI datacenter capex at 0.8-1.3% of GDP, the same magnitude as Japan's 1980s property boom.
Supply-side reinforcement: the full-chain volume/price decomposition (added 2026-07-29)
Testing the proposition: "SK hynix's record revenue is just price increases -- shipments barely grew" -- and its generalization, "the whole AI hardware chain is a price-gouging cartel." The discriminant: a healthy cycle = volume and price rising together; the gouging signature = price up, volume flat, plus active supply discipline, plus buyers with no substitute. All three must hold. Measured segment by segment:
| Segment | Volume (shipment growth) | Price (ASP growth) | Verdict |
|---|---|---|---|
| SK hynix (T1, earnings disclosure) | Q1'26 DRAM bits QoQ flat, NAND bits -10%; Q2'26 DRAM bits +high single digits | Q1 DRAM ASP +mid-60s%, NAND +mid-70s%; Q2 DRAM +30% | Price-led: 70-100% of revenue growth came from price. Q2 revenue 79.3T KRW, an all-time record; operating margin 76% |
| Micron (T1) | DRAM bits QoQ +low single digits | DRAM ASP QoQ +low-60s%, NAND ASP +mid-80s% | Price-led, same pattern as SK hynix |
| Samsung (T3) | -- | Q1'26 ASP QoQ +146% (TrendForce); reportedly seeking another +20% in Q3 | Price-led |
| NVDA (T2/T3) | Real unit growth (Hopper ~2M units in 2024 -> GB200 ~2.52M est.); but total-market accelerator units 2026 ~6.5M, flat-to-down vs 2025 | ASP doubles per generation: H200 ~$31-32K -> GB200 superchip $60-70K; an NVL72 rack ~$3M | Price/mix-led, volume secondary. Its nature is unilateral monopoly pricing plus allocation -- not horizontal collusion |
| TSM (T1, audited annual report) | FY2025 wafer shipments +16.3% (12.9M -> 15.0M 12-inch equivalents) | Revenue +35.9%; price/mix contributed ~17 points, like-for-like hikes only 3-10%, the rest node mix | Roughly half volume, half price -- a genuine bottleneck: CoWoS sold out through 2027, 52-78 week lead times, capacity being quadrupled inside two years -- cleared |
| Servers (SMCI/Dell) (T2) | SMCI revenue +123%; Dell AI servers +757%, backlog $51.3B | SMCI gross margin compressed to 6.4%, actively discounting for volume | Volume-led with no pricing power -- not a cartel; the victim layer of the upstream tax |
The margin gradient is the tax map: memory operating margin 76% (DDR5 approaching 90%) -> GPU gross margin 71% -> foundry ~60% (half volume, half price) -> systems 6.4%. The rent pools entirely in the top two layers -- exactly matching the distribution predicted by logic-spine P3. The hardest single piece of behavioral evidence: SK hynix reallocating HBM4 capacity back to DDR5 (DDR5 margins approaching 90%) -- a producer actively steering capacity to chase price rather than volume. On the NAND side there is explicit "disciplined capacity management" language, with PC/mobile/consumer segments deliberately starved.
Honest counter-mechanisms (the boundary of the gouging verdict): First, HBM consumes ~3x the wafers per bit, so shifting capacity to HBM mechanically depresses bit counts even at full utilization -- a neutral mix effect; "volume didn't grow" alone proves nothing, and the discriminant is total wafer starts (capex +30% YoY, but output relief only arrives 2027+). Second, "700% over four years" is the plaintiffs' figure, not yet confirmed by an independent price index (TrendForce's consecutive quarterly gains of 40-110% point the same direction). Third, the chain's strongest counter-evidence: $/TFLOP still improves 30-50% per year and inference cost per token has fallen ~1000x in three years -- price-performance is improving, which argues the GPU layer is monopoly rent rather than pure gouging. Fourth, the DOJ probe into NVDA concerns allocation and tying, not horizontal price coordination -- a different antitrust animal from the memory class action.
Verdict A supplement: the gouging verdict lands segment by segment
The proposition "SK hynix's record revenue = price, not volume": fully confirmed (record revenue on zero-to-negative bit growth in Q1; price contribution 70-100%). The proposition "the whole chain = a gouging cartel": fails for the chain, holds by segment -- the memory segment meets all three criteria (price-up-volume-flat + explicit supply discipline + a three-firm oligopoly) and is the closest thing to a literal cartel, with collusion sub judice; the GPU segment is unilateral monopoly rent plus allocation (a different tax under a different statute); the foundry is cleared; the server layer is the victim. Monitoring discriminants: if memory wafer starts fail to expand into the 2027 relief window while Q3 prices get revised up again, the gouging verdict upgrades; if DDR contract prices go QoQ-negative or the DOJ escalates criminally (the 2005 DRAM precedent), this segment enters its next phase.
Mandatory counter-examples (the adversarial test before adoption)
| Counter | Content | Strength |
|---|---|---|
| The political vector points the other way | The White House that installed Warsh wants cuts; a Fed deliberately hiking to suppress the nation's flagship industry is politically self-contradictory. | High |
| Market pricing points the other way | December hike priced at just 5.4%, a cut at 15.4%; the weak 7/2 payrolls gave the doves live ammunition. | High (though the May 51% precedent proves one CPI print can flip it) |
| The historical structure mismatches | Plaza/1986 struck a foreign rival to protect domestic industry; hiking against AI strikes one's own. No 1980s script exists for that. And in the BOJ case, the central bank that deliberately pierced its own bubble was nailed to thirty years of deflation -- Warsh knows that precedent. | Medium-high |
Verdict A
The structural judgment (AI OPEC): confirmed, with T1 court-filing support -- but the first suppressing hand is the judicial/trade arm (already swinging), not the Fed. The Fed-hike judgment: wrong on motive, right on mechanism. The tradeable corrected version: do not bet that "the Fed intends to suppress AI"; bet that "AI-capex inflation plus oil pass-through forces Warsh into a hike or a prolonged hawkish hold." Odds: a literal December hike 20-30% (market at 5.4%, dots implying one -- the divergence is the asymmetric payoff); "hike or hawkish hold through mid-2027, no cuts" 60-70%. Suppression does not require the literal hike -- real rates held restrictive through the bubble's late phase kill just as well. Arming triggers: the 08/12 CPI; December hike pricing on FedWatch breaking 30% = thesis ignition.
The write-off cascade thesis: an evidence review
The thesis as stated: there will be no serious rally -- the rallies will bury every bottom-fishing knife catcher. Then come earnings revisions, downgrades, bank and financial-institution write-offs, and possibly a debt crisis.
The five cascade levels and the current position (measured 2026-07-28)
| Level | Stage | Status | Evidence |
|---|---|---|---|
| 1 | Earnings revisions | FIRED | AVGO -14% on 6/4 after guiding AI revenue $16B vs $17.2B expected; July semis lost over $1T of cap; TSM ~-15% for the month. But the mainstream narrative is still "mid-cycle reset"; sell-side targets not yet systematically cut. |
| 2 | Rating/credit downgrades | FIRST CASE | ORCL cut to BBB- by S&P (the last investment-grade rung), 5yr CDS 215bp (07/27; broke the 18-year record at 198bp on 07/17 and kept widening), Q3 FCF -$24.7B; CRWV's $3.1B credit tranche rated only Ba2/BB+ (some lenders passed); Moody's named six major issuers in a credit-quality warning. |
| 3 | Financial-institution write-offs | NOT YET | As of 07/28, not one confirmed bank/BDC write-off against AI/GPU collateral. But the physical preconditions are in place: H100 residual value ~27% of original price (ABS/lease structures typically model ~50% at year 3); BDC median NAV discount 26% (Saba bidding for private-credit stakes at 20-35% off NAV = the market judging marks stale). |
| 4 | Debt-crisis transmission | NOT YET | HY OAS 269-277bp = 16th percentile of the 10-year range (low); IG ~+79bp; tech BBB only +10bp of orderly widening. Index-level credit prices no cascade at all. |
| 5 | Systemic | TAIL | FSB: bank exposure to private credit $220-500B; loans to non-depository financial institutions over $1.2T; the Fed admits limited visibility -- an echo of pre-2008 shadow-banking structure. |
The credit signal panel: single names vs the index (measured 2026-07-27)
On 07/27 -- two days before MSFT/Meta report -- the 5-year CDS of Oracle, Nvidia, Meta and Alphabet rose to all-time records on the same day (Bloomberg-sourced), while HY index OAS sat at the 16th percentile of its 10-year range. (Source disclosure: the same-day record levels come through a single Bloomberg-syndicating channel and are treated as T3; ORCL is separately multi-source confirmed by Bloomberg and Seoul Economic Daily, T1. Re-verify through earnings week.) The single-name layer is pricing the cascade while the index layer denies transmission -- this stratification is the credit-side signature of cascade level 2: the market has begun repricing AI issuers name by name without yet pricing systemic transmission. The direction in which the stratification resolves (single names retreat, or the index catches up) is the cascade thesis's adjudicator.
| Name | 5yr CDS (07/27) | Direction vs 3 months ago | Status | Alert / crisis line |
|---|---|---|---|---|
| ORCL | 215 bp | Wider (144 at end-2025) | RECORD | 250 / 300 |
| SoftBank | 380 bp (03/09 print) | Wider (~347 in January) | STALE DATA | 450 / 550 |
| Meta | 92 bp | Wider | RECORD | 120 / 150 |
| NVDA | 82 bp | Doubled in a month (42 in late June) | RECORD | 120 / 150 |
| AMZN | 67 bp | Wider | ELEVATED | 90 / 120 |
| GOOGL | 64 bp | Wider | RECORD | 90 / 120 |
| MSFT | ~49 bp (07/16 print) | Wider (highest since 2018) | ELEVATED | 75 / 100 |
| HY index OAS | 269-277 bp | Flat/slightly tighter | 10YR LOWS | 380 / 400 (KS-2) |
| IG index OAS | ~79 bp | Flat | LOW | 110 / 130 |
Marginal funding costs confirm the direction: CoreWeave's credit series jumped from SOFR+225 (DDTL 4.0, March) to SOFR+450 (DDTL 5.0, May; ~8.5-8.8% YTM) inside two months; Meta's El Paso SPV pays ~40bp more than Hyperion did ten months earlier (T+225); ORCL's 2056 bond sits at 263bp, its 10-year all-in yield ~6.4% vs a ~5.7% BBB curve. One direction: every new dollar costs more than the last.
Evidence for the cascade
- Issuance scale: ~$570B of AI-related debt in 2026 (4x the prior year's pace); JPM projects $4.1T cumulative by 2030; ~$460B of direct debt across six hyperscalers; capex now consumes nearly 100% of operating cash flow (10-year average: 40%).
- The vendor-financing echo: NVDA's $30B equity in OpenAI + a reported $250B Ohio guarantee (~71x its existing guarantee book) + up to $350B of chip financing under discussion -- structurally identical to Lucent/Nortel lending customers money to buy their own equipment in 2000-02.
- The off-balance-sheet layer: Meta's Hyperion SPV $27B (Blue Owl 80%), the El Paso second deal $13B+ with investors demanding ~40bp more and yields quoted past 7% -- marginal funding costs are rising.
- SoftBank: a $40B unsecured bridge + seeking a $10B margin loan against OpenAI shares (SOFR+425bp); analysts estimate a $32B two-year funding gap.
Evidence against (currently the strongest rebuttal)
- HY OAS at 10-year lows: the market votes with real money that there is no default wave. The strongest rebuttal to the thesis -- and simultaneously the short's best pricing: protection is cheap.
- Zero realized write-offs: cascade level 3 has not happened; the thesis runs ahead of the data.
- SPV structural buffering: held by long-duration buyers (PIMCO/BlackRock types), lengthening the contagion path to banks.
- SoftBank's outlook was revised back to stable on 7/16 -- locally reversing on the downgrade ladder.
- Datacenter REITs (DLR/EQIX) remain investment grade with no negative outlook.
Verdict B
The literal "no rally": not adopted (the base rate of mechanical rallies is ~85%+; the P3 side-switch window stays). The operational meaning -- "rallies cannot be held; they bury dip-buyers": adopted -- in debt-clearing bear markets, the durable rally arrives only after credit clears. The cascade direction: adopted, with honest phasing -- we are at 2 of 5; level 3's physical preconditions (GPU residuals 27%, BDC discounts 26%) are in place, and only the accounting acknowledgment is missing -- watch the 10-K/10-Q seasons. Quantitative revisions to the original document: durable 2027 rally cut from 65-70% to 40-50%; the systemic tail raised from 20-25% to 25-30% (the ORCL CDS record + the 71x guarantee book + the FSB exposure blind spot). Layer 1 rupture at 72-75% and the 2028 Layer 2 terminal stand unchanged.
Trigger dashboard
Regime tests (the master clock)
| TSM raises capex, sold -4% | 07/16 |
| GOOGL $205B, sold -5% (Cloud +82% could not save it) | 07/22 |
| MSFT / Meta, tests #3/#4 | 07/29 |
| NVDA final review (the general's beat-then-die) | 08/26 |
| Criterion: raise sold = confirmation; raise rewarded = tax regime renews | RULE |
The revision chain
| IBM -25% software demand warning (first shot) | 07/14 |
| AVGO AI guidance miss, -14% (the $1T semi selloff fuse) | 06/04 |
| GOOGL operating margin miss (depreciation's leading edge) | 07/22 |
| "Component pricing" language upgrading (April's $5B -> ?) | 07/29 |
| FY27 guidance-season cut scripts (the formal revision) | Oct |
The Fed reaction function (new in v2.1)
| July CPI (oil + AI input costs print) | 08/12 |
| FedWatch December hike pricing >30% = Thesis A ignition (now 5.4%) | DAILY |
| September FOMC dots (June YE26 median already 3.8%) | MID-SEP |
| The crack between Warsh's "regime change" and his AI-inflation dismissal | WATCH |
| Core PCE 3.4% / electricity +4.0% YoY trajectory | MONTHLY |
The AI OPEC judicial/trade arm (new in v2.1)
| Memory antitrust class action filed (N.D. Cal.; 90% DRAM / 95% HBM) | 06/25 |
| $950B Korea-US supply package (SK-NVDA $750B + Samsung-AVGO $200B) | 07/25 |
| DOJ/FTC exclusivity review of the HBM lock-ins | NOT YET |
| DOJ probe of NVDA allocation/tying (the non-collusion track) | REPORTED |
| Memory volume/price split: SK Q1 bits flat / ASP +mid-60s = price contributed 70-100% | 07/28 |
| Memory wafer starts into the 2027 relief window (the gouging-verdict up/downgrade switch) | QUARTERLY |
| DRAM/HBM contract price QoQ (Q1 +105-110% / Q2 +35-48%; a sign flip = phase change) | QUARTERLY |
The write-off cascade (new in v2.1)
| ORCL: S&P BBB- + CDS 215bp record (07/27) + FCF -$24.7B | APR-JUL |
| Moody's names six major issuers in credit-quality warning | 07/24 |
| First confirmed bank/BDC write-off on AI/GPU collateral | NOT YET = THE FUSE |
| BDC median NAV discount >35% (now 26%) | WATCH |
| Meta El Paso SPV pricing >7% / marginal funding cost rising | IN MARKET |
| GPU residuals below 20% of original price (now ~27%) | WATCH |
The five whales' counterparties
| ORCL $553B RPO (OpenAI) -- stock already -65% | PRICING |
| GOOGL $514B backlog (Anthropic ~40%) | DISCLOSED |
| MSFT RPO contains OpenAI $250B -- answer quality | 07/29 |
| SNDK $42B / SMCI $60B single-quarter orders | 08/11 |
| Anthropic $900B+ round: close/flat/down | Q3 |
| NVDA $250B guarantee + $350B chip financing talks (circular proof #7) | 07/27 |
The memory cycle
| SK Hynix ADR listing = distribution milestone | 07/10 |
| MU/SNDK failed rallies (-10%/-11% after blowout prints) | JUL |
| NAND contract price QoQ <+30% (the reversal confirmation light) | Q4'26-Q1'27 |
| All three majors announce NAND expansion (the 84.6% margin invitation) | WATCH |
Credit gates
| HY OAS now 269-277bp (16th pct of 10yr): 380 alert / 400 freeze / 500 crisis | LOW |
| AI single-name CDS collective same-day records (ORCL 215 / Meta 92 / NVDA 82 / GOOGL 64) | 07/27 |
| NVDA CDS doubled in a month (42 -> 82bp); through 120 = credit-side escalation | WATCH |
| Stratification resolution (single names retreat or HY catches up) = cascade adjudicator | WEEKLY |
| BDC discounts (the listed proxy for private-credit marks; median 26%) | WATCH |
| Bank -> NBFI pipeline (>$1.2T; FSB blind-spot warning) disclosures | EARNINGS |
| Swap spreads / Treasury basis anomalies (the systemic transmitter's EKG) | WATCH |
China convergence (the enemy of time)
| Band climb: 80.6 vs 88.7, ~1 pt/month -> 85-88 threshold @H1 2027 | MONTHLY |
| Z.AI 1GW fully domestic compute (Huawei Ascend; GLM-5.2 tops charts) | 07/20 |
| OpenRouter July board: top 7 all Chinese/open (MiMo 33T +121% / GLM +306%); GPT-5.5 only #16; Sonnet 4.6 -40% | JUL |
| China's $295B national compute network (80% domestic silicon) | DRAFT |
| WF6/tungsten export-control cost pass-through (hardware cost floor rising) | 07/01 |
The distribution pipeline
| SPCX broken IPO at $113 (-50% from peak; shorts up $15.5B) | JUL |
| OpenAI IPO postponed to 2027 (NYT + JPM financing language) | 06/26 |
| SPCX lockup front-run -> expiry day | 12/12 |
| Sell-side research turns systematically bearish (Goldman/JPM) = the last-leg starting gun | KEY |
Kill switches
KS-1 REGIME INVALIDATION
MSFT+Meta+NVDA ALL rewarded for capex + CPI cooling + credit calm + SPCX reclaiming $135 -- all four together -> cut front-months, downgrade and reassess the framework. Three of four does not count.
KS-2 CREDIT GATE
HY OAS sustained >400 -> the third-year script is void, Wave 2 fully frozen, cash is king (the 1930 path; tail now raised to 25-30%). >380 already pauses new longs.
KS-3 PROFIT PROTECTION
Any leg giving back 50% of peak gains -> cut unconditionally. No narrative appeals.
KS-4 F&G DISCIPLINE
Never add shorts in the Fear zone (bear trap); scale at Greed 55+, full load at Extreme Greed 75+ (harvesting the bull trap).
KS-5 VERSION VERDICT GATE
2027 elasticity >1 -> fill tranche 3; <1 -> longs stop, the 2028 short list activates. Before the verdict, longs never exceed 2/4 ammunition.
KS-6 SELL-SIDE TURN
Goldman/JPM research turning systematically bearish for the first time = distribution officially complete = the starting gun of the final downleg. Until then, independent voices shouting do not count as signal.
KS-7 CASCADE GATE (new in v2.1)
The first confirmed financial-institution write-off on AI/GPU collateral (10-K/Q or announcement) -> the cascade enters level 3 -> shift the whole Wave 2 tranche plan one tier lower, freeze tranche 3 until HY OAS rolls over from its peak. Reverse: zero write-offs by Q2 2027 with HY OAS <320 -> downgrade the cascade thesis, restore P5 rally odds.
Key levels and probability structure
| Name | Character | First batch / main zone / deep bear | Logic anchor |
|---|---|---|---|
| NVDA (PRIMARY SHORT) | Main name of the two-layer unwind; thesis-tracker anchor: peak $217 (05/12); Phase 1 = Cisco-style margin reset | Phase 1 trough $80-110 | GM 71% -> 45-50%, P/S 24x -> 8-10x; instrument = rolling 2-12mo OTM puts, no LEAPS (theta death) |
| GOOGL (compounding core) | The free world's only ad winner + TPU dodges the NVDA tax | $230-235 / $185-195 / $155-165 | Clean EPS $8.5-10 x 15-17x + cash; 50-60% of Wave 2 ammo |
| NET (convexity satellite) | The agent economy's tollbooth; Version B accelerates the narrative | -- / $95-125 / $75-85 | 9-12x FY27-28 sales; position cap 15-20%; lose small, win big |
| TSM (rent) | Dual-cycle foundry monopoly; prepayments are a hard floor | $240 / $190-200 / $140-160 | Clean EPS $8.5-10.5 x 12-14x; +50-100% recovery = must sell |
| GEV (rent) | Electricity = the common denominator of every AI version | Wave 2 tier prices | 50-70% recovery class; collect the rent and leave |
| ARM (trade) | Edge-relay beneficiary; the RISC-V flag has not been struck | $95-110 / $70-90 | Position cap <=5%; CSS cuts both ways |
| ORCL (event) | Legacy value $45-75; the live specimen of cascade level 2 (BBB- + record CDS) | Buy zone $50-70 (overshoot) | The catalyst paradox: a capex-cut announcement = the FCF reversal day = trade -> hold upgrade |
| SPCX (short/event) | Legacy floor $22-35; the false flow floor $45-70 | Lockup puts target $70-80 | The only key that flips it long: an xAI shutdown announcement (+$6.4B/yr FCF) |
| SNDK (PRIMARY SHORT) | Pattern-3 pure commodity; no escape path in physical AI | End game $200-350 | Jun'27 core leg; NAND QoQ <+30% = the confirmation light |
The mismatch doctrine: why this document makes you smarter
All suffering in human society comes from mismatch, and financial markets most of all -- the mismatch of money, of time, of emotion, of trust. A bubble is the sum of all four; the clearing is their forced correction.
Having read the first eight sections, you have not read eight topics; you have read eight faces of one thing. Every table, every trigger, every kill switch in this handbook is a part of the same machine: identify the mismatch, then stand on the side of its correction.
The mismatch of money
Capital pools exactly where it is least needed: 76% operating margins in memory, 71% gross margins in GPUs -- while the application-layer ROI loop, the only thing that decides whether this revolution works, starves (logic spine P1-P3). The margin gradient in Section IV -- 76 / 71 / 60 / 6.4 -- is not four numbers; it is a map of misallocation. Vendor financing is money-mismatch in its extreme form: the seller lends the buyer money to buy the seller's goods, and the money circles in place while value moves not one step. What the market is doing now -- repricing name by name, punishing capex raises -- is chasing money from the wrong places back to the right ones.
The mismatch of time
A five-year, $950B lock signed twelve months before the renegotiation season; three-year depreciation schedules resting on GPUs worth 27% of cost; 2028 LEAPS dying of 2026 theta. Behind every loss sits a pair of unaligned durations. Hence this handbook's single instrument rule: the instrument's duration must match the thesis's phase -- rolling 2-12 months before 2028, LEAPS only from R5 onward. The reason Benner's 150-year-old card earns its place in Section II is that it performs exactly this calibration: it tells you which beat of the rhythm you are standing on, so you do not live a sell year with a buy year's moves.
The mismatch of emotion
Greed at the top makes buyers panic-lock capacity at peak prices (Correction 2); fear at the bottom will keep the same people out of a generational entry (2032). The buried knife catcher is not unlucky -- he is paying the invoice for an emotion out of phase with the market. The KS-4 F&G discipline is an anti-mismatch machine: never add shorts in Fear, scale at Greed 55+/75+ -- it forces you to act precisely when your emotions and the market's phase point opposite ways. Every line of R1-R6 in Section III -- "load at rally tails, never chase weakness" -- is the same discipline made concrete.
The mismatch of trust
Trust in the wrong place is a negative asset: BDC marks so stale that Saba bids at 20-35% off, ratings running a quarter behind CDS, circular financing booking "revenue" against self-guaranteed debt, the HY index still denying what single names have already set records saying. The T1-T5 legend in Section IV is a price list for trust -- how much a court filing or a market price is worth, how much a "person familiar with the matter" is worth, graded cell by cell. The stratification signal (single-name CDS vs the index) is, at bottom, a mismatch between two layers of trust inside the same market -- and its resolution names whose trust was wrong.
"Getting smarter" therefore has an operational definition in this handbook: intelligence = identifying the mismatch one step before the market does, and aligning your four accounts -- money, time, emotion, trust -- with the direction of correction. The suffering is unavoidable; but it can be someone else's -- provided that before the mismatch is forcibly corrected, you are already standing on the other side of it.
References
Sources cited in the v2.1 evidence review (accessed 2026-07-28/29)
- South Korean chipmakers to supply US tech firms in $950b dealsTHE JAKARTA POST, 2026-07-26
- Samsung and SK Hynix Lock In AI Chip Supply Through 2030 With $950B in US DealsTECH TIMES, 2026-07-25
- Samsung Strikes $200 Billion AI Chip Deal; SK Extends HBM4 SupplySEOUL ECONOMIC DAILY, 2026-07-26
- Samsung, SK hynix, Micron Face U.S. Class-Action Lawsuit Over Alleged DRAM Supply ManipulationTRENDFORCE, 2026-06-29
- Jensen Huang to SK hynix: "Please Make More HBM"SEOUL ECONOMIC DAILY, 2026-06-02
- Statement by Kevin Warsh, Chair, Board of Governors of the Federal Reserve SystemFEDERAL RESERVE, 2026-07-14
- FOMC Minutes, June 16-17, 2026FEDERAL RESERVE
- Warsh says AI spending may lift prices without fueling lasting inflationAXIOS, 2026-07-15
- Warsh pledges "regime change", cites benefits of AI investment boomCNBC, 2026-07-14
- CME FedWatch ToolCME GROUP, accessed 2026-07-28
- Traders now see next Fed move as a hike following inflation surgeCNBC, 2026-05-15
- Massive AI buildout poses latest inflation threatWASHINGTON TIMES, 2026-07-13
- How the AI bubble could pop, per the BISTHE REGISTER, 2026-06-29
- Bond investors push back as AI debt heads toward $570 billionFORBES, 2026-07-17
- Moody's: unprecedented AI spending threatens credit qualityCNBC, 2026-07-24
- Oracle's credit risk is at an all-time highMOTLEY FOOL, 2026-04-10
- Oracle default risk hits record highSEOUL ECONOMIC DAILY, 2026-07-21
- Meta taps PIMCO and Blue Owl for $29bn data center financingDATA CENTER DYNAMICS
- Meta's El Paso bond exposes AI debt repricingCAPACITY, 2026-07
- Nvidia's circular financing: $250B guarantee, $350B chip financing talksAXIOS, 2026-07-27
- FSB report: bank exposures to private creditFINANCIAL STABILITY BOARD, 2026-05-06
- Private credit BDCs trade at deepest NAV discounts in over five yearsPRIVATE EQUITY WIRE, 2026
- Nobody knows what a used GPU cluster is worthCIPHERTALK, 2026
- ICE BofA US High Yield Option-Adjusted SpreadFRED / TRADING ECONOMICS, 2026-07-23
- The Great Telecom ImplosionTHE AMERICAN PROSPECT, 2002-08-19
- SoftBank's OpenAI liquidity crunchCNBC, 2026-06-04
- Big Tech CDS Hits Record as $244 Billion AI Bond Surge Stokes Market StressBLOOMINGBIT (BLOOMBERG-SOURCED), 2026-07-27
- Gauge of Oracle's Credit Risk Hits Fresh All-Time HighBLOOMBERG, 2026-07-17
- CoreWeave's new debt facility: SOFR+450DEEP QUARRY, 2026-05
- ICE BofA US High Yield Index Option-Adjusted SpreadFRED, accessed 2026-07-28
- SK hynix Announces 2Q26 Financial ResultsSK HYNIX NEWSROOM, 2026-07-28
- Memory 1Q26 Price Surge: Samsung Flags 146% ASP Jump, SK hynix Sees Mid-60% DRAM GainsTRENDFORCE, 2026-05-18
- SK Hynix: Choosing DDR5 Profits Over HBM4 RampTECH TIMES, 2026-06-24
- Micron Fiscal Q3 2026 Earnings Call Prepared RemarksMICRON IR, 2026
- TSMC Annual Report: wafer shipments and revenue decompositionTSMC IR
- NAND 1Q26 contract price revision +55-60% QoQTRENDFORCE, 2026-02-02
- Nvidia DOJ antitrust probe over allocation and tying practicesTECHPOWERUP
- AI inference economics: cost-per-TFLOP and token cost trendsGPUNEX, 2026